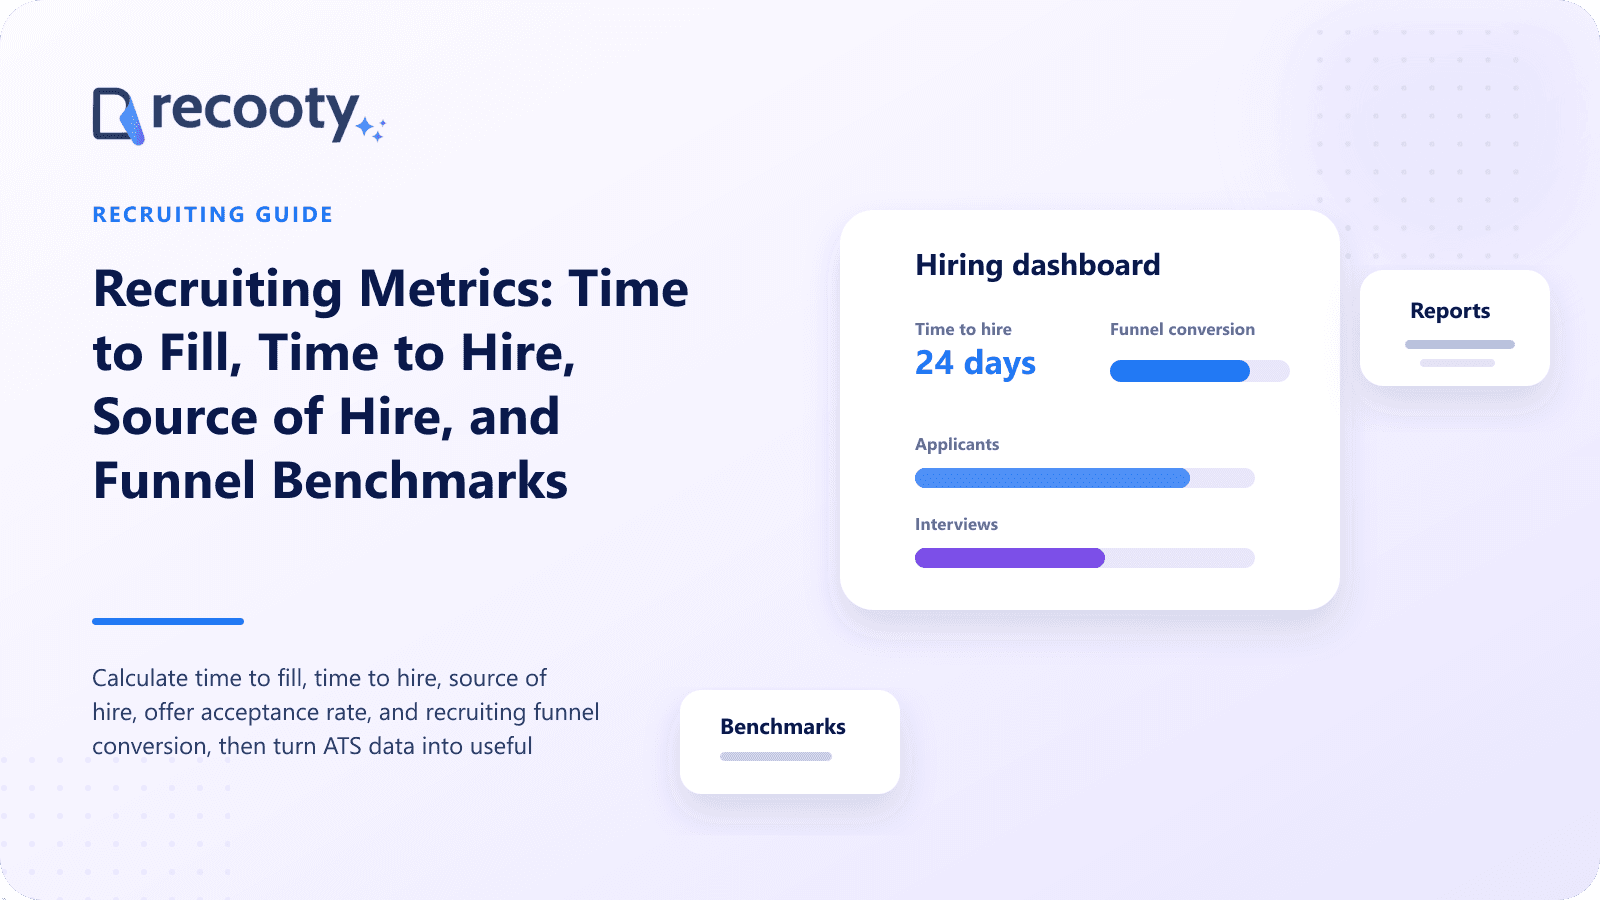
Recruiting Metrics: Time to Fill, Time to Hire, Source of Hire, and Funnel Benchmarks
Calculate time to fill, time to hire, source of hire, offer acceptance rate, and recruiting funnel conversion, then turn ATS data into useful benchmarks.

CONTENTS
- 00Introduction
- 01Key takeaways
- 02What recruiting metrics should an ATS track?
- 03What is the difference between time to fill and time to hire?
- 04What is a good time-to-fill benchmark?
- 05How do you calculate source of hire?
- 06How should source quality be measured?
- 07How do you calculate offer acceptance rate?
- 08What are recruiting funnel benchmarks?
- 09Which metrics reveal recruiting bottlenecks?
- 10How can Recooty report recruiting performance?
- 11Frequently asked questions
Teams comparing recruiting software can use this overview to assess which workflow fits their hiring process.
The core recruiting metrics are time to fill, time to hire, source of hire, offer acceptance rate, stage conversion, time in stage, candidate withdrawal, and hiring-plan progress. Time to fill measures vacancy speed; time to hire measures candidate journey speed. Funnel metrics show where volume changes and where work stalls.
Metrics work when definitions stay consistent and lead to decisions. A company average can hide long engineering approvals or hourly-candidate withdrawal.
Key takeaways
- Time to fill usually starts when a requisition opens and ends when an offer is accepted.
- Time to hire starts when the chosen candidate enters the process and ends at acceptance.
- Source of hire should credit the channel that led to the hire under a documented attribution rule.
- Offer acceptance rate equals accepted offers divided by eligible offers extended.
- Funnel benchmarks should be segmented by job family, level, location, source, and hiring model.
- Pair speed with candidate experience and quality signals so teams do not optimize for fast but weak decisions.
What recruiting metrics should an ATS track?
An ATS dashboard should show plan progress, slow stages, productive sources, and candidate or offer loss.
| Metric | Basic formula | What it diagnoses |
|---|---|---|
| Time to fill | Offer acceptance date minus requisition open date | Workforce-planning and vacancy speed |
| Time to hire | Acceptance date minus chosen candidate's process-entry date | Candidate journey speed |
| Time in stage | Stage exit timestamp minus stage entry timestamp | Workflow bottlenecks |
| Stage conversion | Candidates entering next stage divided by candidates entering current stage | Funnel selectivity and loss |
| Offer acceptance rate | Accepted offers divided by eligible offers extended | Closing strength and offer alignment |
| Source of hire | Hires credited to a source divided by total hires | Channel contribution |
| Cost per hire | Eligible recruiting cost divided by hires | Financial efficiency |
| Candidate withdrawal rate | Candidate withdrawals divided by active candidates in scope | Candidate friction or changing interest |
Write the definition beside every report. Process entry might mean application, first contact, or screening, and each produces a different result.
What is the difference between time to fill and time to hire?
Time to fill measures how long the organization takes to fill a vacancy. Time to hire measures how long the selected candidate spends in the hiring process. The first is job-centered; the second is candidate-centered.
Example: a requisition opens on April 1, the eventual hire applies on April 18, and accepts on May 10. Time to fill is 39 days if the calculation excludes the start date. Time to hire is 22 days using application as process entry.
Time to fill includes approvals, job drafting, sourcing, and advertising. Time to hire focuses on screening, scheduling, interviews, decisions, and offers after the chosen person enters.
What is a good time-to-fill benchmark?
There is no useful universal target for every job. SHRM's 2025 recruiting benchmark reported median time to fill at roughly a month and a half for executive and nonexecutive positions, but an external median does not account for your role scarcity, location, approvals, season, or hiring model.
Build an internal baseline using the median and 75th percentile for similar jobs. Segment by job family and level, then add location, source, or employment type when samples allow.
Use the median rather than only the average. A few roles open for 200 days can pull the average upward and make ordinary hiring look slower than it is.
How do you calculate source of hire?
Source of hire identifies the channel credited with producing a hired candidate. The formula is hires attributed to a source divided by all hires in the period, usually expressed as a percentage.
Attribution is the difficult part. A candidate might click a social post, visit the careers page later, speak to an employee, and apply through a job board.
When the role is ready, you can post a job for free to start reaching candidates. Choose and document a model:
- Application source: the tracked channel that delivered the application
- Self-reported source: what the candidate says introduced the role or employer
- First touch: the earliest recorded recruiting interaction
- Last touch: the final tracked source before application
- Influenced source: several channels receive separate influence credit
Keep unknown visible rather than forcing bad data into a preferred channel. Use campaign parameters, board IDs, referral links, and source fields.
How should source quality be measured?
Application count measures activity. Compare each source by completed applications, qualified screens, interviews, offers, hires, cost, speed, candidate experience, and later outcomes where lawful.
A board producing 1,000 applications and two interviews may create more work than a referral channel producing 20 applications and five interviews. Report conversion and cost beside volume so decision-makers can see the tradeoff.
How do you calculate offer acceptance rate?
Offer acceptance rate equals accepted offers divided by offers extended, multiplied by 100. Define which offers qualify. Withdrawn drafts, duplicate offers, or offers canceled because a requisition closed may need separate treatment.
For example, 17 accepted offers from 20 eligible offers produce an 85% acceptance rate. Segment by role, level, recruiter, location, and hiring manager before drawing conclusions. A low rate can reflect compensation, timing, role changes, candidate experience, competing offers, work model, or weak expectation setting.
Record a structured decline reason instead of making recruiters guess. LinkedIn's C-suite metrics guidance recommends comparing acceptance with internal history.
What are recruiting funnel benchmarks?
Recruiting funnel benchmarks are expected candidate counts, conversion rates, and stage times for comparable hiring processes. A funnel might track sourced or applied, screened, interviewed, assessed, finalist, offered, accepted, and started.
Calculate adjacent-stage conversion. If 200 apply, 40 enter screening, 10 interview, two receive offers, and one accepts, conversions are 20%, 25%, 20%, and 50%.
Build benchmarks this way:
- Standardize stage names and entry rules.
- Remove test and duplicate candidates.
- Group similar roles and hiring models.
- Use at least several completed requisitions or label small samples clearly.
- Calculate median volume, conversion, and time in stage.
- Review the 25th and 75th percentiles, not one target alone.
- Revisit benchmarks quarterly and after a major process change.
A lower conversion may reflect broad reach, inaccurate advertising, easy applications, or a high bar. Read it with source quality and candidate experience.
Which metrics reveal recruiting bottlenecks?
Time in stage and aging candidates locate bottlenecks faster than total time to fill. Report the median, oldest active candidates, and percentage beyond a service target for each stage.
Common patterns include:
- Long approval time before publication
- High application volume but few qualified screens
- Several days between screen and interview booking
- Low scorecard completion after interviews
- Long decision or offer-approval time
- High withdrawal during an assessment
- Offer declines concentrated under one range or work model
Assign each stage an owner and response window. Use reminders without flooding users.
How can Recooty report recruiting performance?
Recooty analytics monitor time to hire, sources, funnel movement, and activity. Pipelines, distribution, scorecards, scheduling, and feedback create the underlying timestamps and outcomes.
Read Recooty's guide to recruiting metrics and its advice on reducing time to hire with an ATS. Agree on definitions before comparing a new dashboard with an old spreadsheet.
Frequently asked questions
Does time to hire start at application or first contact?
Either can be used, but the organization must choose and disclose one definition. Application works for inbound hiring; first meaningful contact may fit sourced candidates. Keep separate measures when both models matter.
What is a good offer acceptance rate?
A good rate meets the company's hiring plan and remains stable or improves for comparable roles. External percentages can provide context, but internal history by role, location, and level is more actionable. Investigate decline reasons rather than chasing one generic target.
How often should recruiting metrics be reviewed?
Recruiting teams can review active aging and stage flow weekly, completed funnel performance monthly, and strategic benchmarks quarterly. Leadership reporting should match hiring volume and decision cycles.
Can faster hiring reduce quality?
Yes, if speed removes job analysis, structured evaluation, or needed checks. Speed can also improve quality by reducing idle time and candidate loss. Pair time metrics with scorecard evidence, candidate feedback, offer acceptance, retention, and performance measures.
Practical recruiting playbooks, HR tutorials and hiring trends from the team behind Recooty — hiring software for growing teams.